BHMag Visualizer
B(H) Modeler for Magnetic Materials
Engineers measure the magnetic property of soft magnetic materials as a B(H) magnetization
curve. It plots the magnetic flux density B tesla in a material with the applied magnetic field
strength H A/m. But the measurements are limited to 1.8 T while some parts of electric machines
can carry 2 T or more. Measured data can also be rough, which slows down the speed of
computation. Engineers, therefore, need an analytical model (i.e. a numerical expression) that fits
the measured B(H) data to extrapolate it to saturation and to speed up the computations. Over the past century, several fertile minds have suggested scores of B(H) models. But none have fitted the B(H) curves of a wide range of soft magnetic materials accurately. So the problem
of modeling the magnetization curves of diverse grades has remained unresolved so far.
MagWeb has recently succeeded in developing a proprietary model to fit diverse magnetization
curves accurately. Called Generalized Frohlich Model (GFrom), it is based on the classic Froelich
model (which used the last few points of measured data to calculate the saturation flux density).
GFrom successfully fitted thousands of magnetization curves available in MagWeb’s database to
less than 2% error.
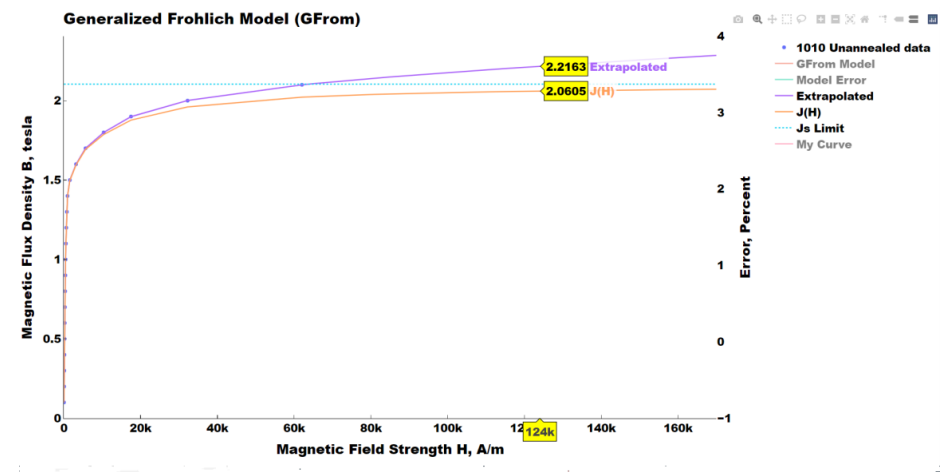
MagWeb has also developed a proprietary BHMag visualizer that overlays the GFrom magnetization curve over measured data. It also displays extrapolated B(H) curves, saturation curves, error plots, etc. It can be used to read off data interactively. Fig. 1 shows a sample visualizer plot for 1010 Unannealed Steel.
You can incorporate this B(H) modeler or visualizer into your field software to protect your machines against over fluxing or to speed up computations. This BHMag modeling and visualization software will be available on MagWeb’s Website soon.
For more information, please email to: rao@magweb.us